The Data Viewer
The Data Viewer is a central part of the module, as the most important aspect of the DataMapper is obviously the data. It displays the content of the Data Source that is currently loaded in the DataMapper in a way that is easy to view and interact with. What is seen in the Data Viewer, however, is not simply the raw Data Source. It is formatted to fit your screen and can be modified through the use of a Preprocessor. The Data Viewer itself is surrounded by two different areas: the toolbar at the top and the data map on the left. The toolbar is used to control a few options in the viewer. For example, with a text file Data Source, the font displaying the text can be changed. A button can also hide the data map, and zoom controls are also available. Some of the toolbar features may be unavailable, depending on the Data Source type. The data map on the left gives you precise indications on how the cursor moves within the DataMapper. The cursor defines where data extraction starts. It starts at the top left of the screen and moves down as you go through the data. Data is always extracted using an offset or a relative position from the current cursor location. This is how totals can be extracted at the end of an invoice with a variable number of lines, since the total is always from the same distance to the last line of the invoice. The offset is always the same. The data map can therefore indicate loops, gotos as well as condition results for each line.
When the Delimiter and Boundary options are set in the Settings Pane, the Data Viewer reflects those changes and can display more than one unit of the data sample (page, XML node, CSV line, etc.), depending on these options.
Data Selection
There are three different ways to create a data selection inside the Data Viewer, depending on the Data Source type that is currently loaded. Data selections can be used for Condition, Repeat and Extraction steps.
Tabular Data
Tabular data is displayed in a table where multiple fields appear for each line or row in the original data. Selections can only be done on each line, meaning you cannot select data from multiple rows at the same time. You can select multiple fields at once in the same row using features you would expect. Click & drag to select multiple fields or use CTRL-click and SHIFT-click combinations.
PDF and Text
PDF and text are both handled in basically the same way. You can select any area of one or more lines on the page. These selections can be moved and resized simply by dragging them and using the respective resize handles. As long as data selections exist, any step you add does not remove that data selection.
Here is a small trick to extract multiple lines. Make a selection for the first line, click on Add Extract Step, move the selection to the next line, then click Add Extract Field and so on until the end of the data you want to extract. To actually use the data selection instead of moving it, use the drag icon at the right of the selection and drag it into the Data Model pane to create an extraction.
PDF and text Data Sources are unique in the sense that, if you select any extracted field in the Data Model pane or an extract step, you can change the data selection for that extracted field in the same way you move and resize data selections. This will modify the extraction properties for that field.
XML
XML data is displayed as a tree view inside the Data Viewer. You can select multiple fields inside an XML file using SHIFT-click and CTRL-click even if those fields are on different levels. So if you start with the full name and end at the Total field, you can select all of them and drag them into the Data Model pane for a quick extract step. You can also collapse any XML level if you are not using it or do not need to see its content. Note that specifically for XML files, in most cases it is not necessary to use a Goto step. For example, if a Repeat step is added, you can see that a Goto is not added before or within th loop. This is because XML has its own method of moving through the file, "Xpath", and we take advantage of this in the software. Once data is extracted from the Data Source, it is possible to see exactly where all the data comes from. Clicking on any Extract step highlights any area from which it extracts data. You can also click on the Preprocessor step to select all the steps in the workflow to show a complete map of all the data extracted from the Data Source. As you may have already realized, there are multiple ways to interact with the Data Viewer, especially when creating data selections and using them to create steps. Dragging a data selection into the Data Model pane will extract the data to the selected location, either the record itself or the detail table. If any extract step is already selected, fields are added to it. Dragging a data selection into an existing extract step forces new fields to be added. A new extract step is never created. Right-clicking on a data selection displays the actions (contextual menu) that can be done with that selection or the steps that can be added to them. That menu also displays the keyboard shortcuts.
Window Controls
The following controls appear at the top of the Data Viewer:
- Font (Text file only): Use the drop-down to change the font used to display text. Useful for double-byte data. It is recommended that monospace fontsA font whose letters and characters each occupy the same amount of horizontal space. This contrasts with variable-width fonts, where the letters and spacings have different widths. be used.
- Hide/Show line numbers
 (Text file only): Click to show or hide the line numbers on the left of the Data Viewer.
 - Hide/Show datamap
 : Click to show or hide the icons to the left of the Data Viewer which displays how the steps affect the line.
 - Hide/Show extracted data
 : Click to show or hide the extraction selections indicating that data is extracted. This simplifies making data selections in the same areas and is useful to display the original data.
 - Lock/Unlock extracted data
 : Click to lock existing extraction selections so they cannot be moved or resized. This simplifies making data selections in the same area.
 - Zoom Level: Use the arrows to adjust the zoom level, or type in the zoom percentage.
- Zoom In (CTRL +)
 : Click to zoom in by increments of 10%
 - Zoom Out (CTRL -)
 : Click to zoom out by increments of 10%
Additional Keyboard Shortcuts for XML Files:
- + (while on an XML node with children): Expand the XML Node
- - (while on an XML node with children): Collapse the XML node, hiding all its children nodes.
Contextual Menu
You can access the contextual menu using a right-click anywhere inside the Viewer window:
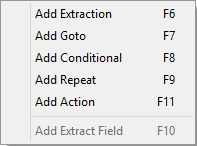
The Add Extract Field item is available only after an Extract step has been added to the workflow.
For more information about the different steps that can be added to a Data Mapping workflow, please refer to Steps.
Operations
In the following example, clicking on the Repeat step shows in which lines the loop takes place. Click on the Goto within the loop to show which lines are skipped. Clicking on a Condition shows whether that condition is true or false for each line.
Drag and drops from the Viewer window to the Data Model pane can be performed to extract data.